-
[Classical Control]Controller Design: RobustnessEngineering/Control 2022. 4. 17. 23:16
1. Introduction
시스템 모델의 Uncertainty를 줄이기 위해 Robustness를 분석한다. Robustness는 Optimal control과 Adaptive control에서 중요한 역할을 한다. 이 포스팅에서는 Robustness를 고려하는 개념인 Gain margin과 Phase margin을 다루며 이전 포스팅에서 활용한 Nyquist plot을 통하여 개념에 접근한다.
2. Stability from Nyquist Plot
우선 Robustness를 정의하여 구하기 전에 Nyquist plot으로부터 Stability를 구하는 방법을 살펴보자. Poles와 Eigenvalues, 그리고 RH table을 통해서 Stability를 구하는 방법이 기본이기 때문에 이 방법으로 Stability를 구하는 것은 참고로 알아두기만 바란다. Figure 1.가 정의되었다고 할 때 각 함수는 Equation 1.과 같이 변환할 수 있다.

Figure 1. Transfer Function 
Equation 1. 이를 토대로 Equation 2.를 도출할 수 있다. 여기서 다음과 같은 두가지를 알 수 있다. T(s)는 Closed-loop transfer function이다.
- Poles of 1+G(s)H(s) = Poles of G(s)H(s)
- Zeros of 1+G(s)H(s) = Poles of T(s)

Equation 2. 여기서 Closed-loop transfer function의 안정성이 Equation 3.과 같이 정의된다.

Equation 3. P는 RHP(Right-Half Plane)에서 Number of Poles of 1+G(s)H(s)이고, Z는 RHP(Right-Half Plane)에서 Number of zeros of 1+G(s)H(s)이며, N은 CCW 방향으로 G(s)H(s) curve가 -1을 감싸는 개수이다. Figure 2.를 통해 Nyquist plot으로부터 Stability를 구해보자.

Figure 2. Transfer Function for Nyquist Plot Figure 2.를 통해 Nyquist plot을 그려보면 Figure 3.이 되고, -1을 총 2번 감싸게 된다.
H = tf([1 8 15],[1 -6 8])
nyquist(H)
Figure 3. Nyquist Plot of Figure 2. 이를 통해 Equation 4.와 같이 계산되고, Unstable poles가 2개 있는 Unstable system이 된다. 이는 실제 RHP에서 2개의 Pole을 가지고 있기 때문에 기존의 Poles을 활용한 Stability로도 파악할 수 있다.

Equation 4. 3. Gain Margin and Phase Margin from Nyquist Plot
위처럼 Stability를 Nyquist plot에서 분석하는 이유는 Gain Margin과 Phase Margin을 정의하고 그 관계에서 Robustness가 판단되기 때문이다. 우선 Gain margin과 Phase margin의 정의는 Figure 4.로부터 나온 각각 Equation 5.와 Equation 6.과 같다. 해당 Plane은 Controller와 Model의 Transfer function인 C(s)G(s)의 Plane으로 Nyquist plot Stability 기준에 따라 두가지로 그려진다.
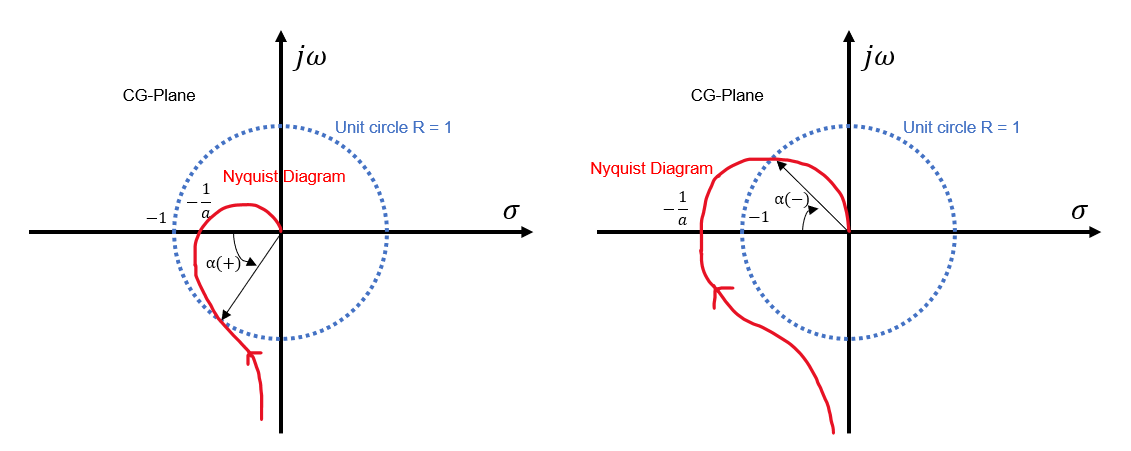
Figure 4. Gain Margin and Phase Margin from Nyquist plot 

Equation 6. 왼쪽은 Nyquist stability를 만족한 형태이고, 오른쪽은 만족하지 못한 형태이다. 아래는 원론적인 정의다.
- The gain margin is the change in open-loop gain, expressed in decibels (dB), required at 180° of phase shift to make the closed-loop system unstable.
- The phase margin is the change in open-loop phase shift required at unity gain to make the closed-loop system unstable.
따라서 Gain margin과 Phase margin은 크면 클수록 Stability 확보의 기준이 되는 -1과 멀어져서 Stable한 시스템을 설계할 수 있기 때문에 용이하다.
Actual Model = Theoretical Model + Uncertainty(Perturbation)
Equation 7.Equation 7.과 같이 Actual model은 Uncertainty를 가지고 있다. 이를 Block diagram 형태로 표현하면 Figure 5.와 같다.

Figure 5. Actual Control System 이때 Gain margin과 Phase margin을 Nyquist plot에서 비교해보면서 Uncentainties를 포함해도 Stability를 만족하는지 유의하여 시스템을 설계한다. Figure 6.과 같이 Uncertainties가 있을 때 Nyquist stability를 만족시킬 수 있도록 한다.

Figure 6. CG Plane with Uncertainties 4. Gain Margin and Phase Margin from Bode Plot

Figure 7. Gain Margin and Phase Margin from Bode plot Bode plot에서 Gain margin과 Phase margin은 Figure 7.처럼 정의된다.
- Gain margin은 Bode plot의 Phase plot에서 180[degree]로 cross되는 Frequency의 0[dB]에서부터 크기이다.
- Phase margin은 Bode plot의 Gain plot에서 0[dB]로 cross되는 Frequency의 180[degree]에서부터 절대값으로 커진 각도이다.
* Reference
Github Simulation: https://github.com/TitusChoi/Classical_Control/
Figures:
1. Nise, N. S. (2015). Control systems engineering.반응형'Engineering > Control' 카테고리의 다른 글